
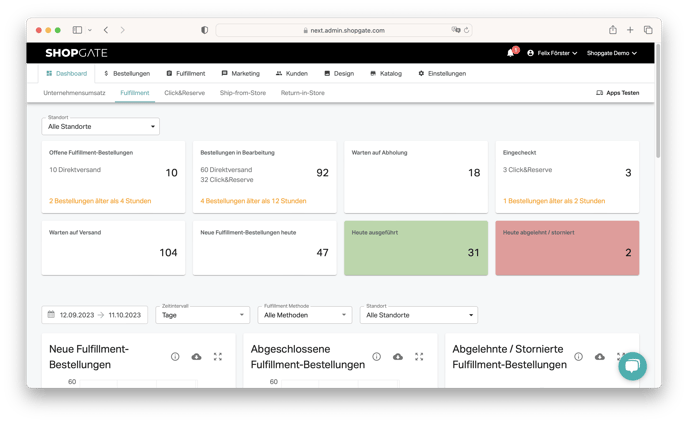
The Shopgate Fulfillment Dashboard is divided into 2 areas:
1. The live status of all orders in the system
2. A historical overview of store performance across various KPIs
Filters
You can easily filter the live status by location.
You can filter the historical overview by date, time interval, fulfillment method and location.
Live status
The live status shows the current status of your fulfillment process. The first 5 boxes each show the status of fulfillments within the process. Here you can see, for example, how many fulfillments are currently open, in progress or checked in. Each box shows an absolute number and a number per fulfillment method.
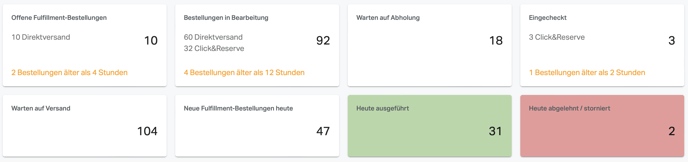
Below that, a colored hint shows how many fulfillments have been in the respective status for longer than desired. Shopgate can adjust these times individually for you. Feel free to contact us about this.
The default times are:
- Open: 4 hours
- In progress: 4 hours
- Waiting for pickup: 72 hours
- Checked in: 2 hours
- Waiting for shipping: 24 hours
The last 3 boxes show how many fulfillments were newly created, shipped or rejected today.
All numbers can be clicked and link to a correspondingly filtered fulfillment list.
Historical overview
The historical overview shows data for the following KPIs:
New fulfillment orders: This chart shows the newly created fulfillment orders at the time they were created.
Completed fulfillment orders: This chart shows the completed (status "Fulfilled") fulfillment orders at the time they were completed. Only successfully completed orders are taken into account. Rejected or canceled orders are not shown.
Rejected / canceled fulfillment orders: This chart shows the rejected or canceled orders at the time they were rejected / canceled.
Line item fulfillment rate: This chart shows the percentage of successfully fulfilled line items compared to rejected line items. Only line items of fulfillment orders that were completed / rejected / canceled are taken into account, and they count at the time they were completed / rejected / canceled.
Completed revenue: This chart shows the total revenue of all completed (status "Fulfilled") fulfillment orders at the time the order was completed. Only successfully completed line items are taken into account. Rejected or canceled orders/line items are not taken into account. Important: Since this chart is based on fulfillment orders, shipping costs and order-level promotions are not included in the revenue.
Completed revenue by location type: This chart shows the total revenue of all completed (status "Fulfilled") fulfillment orders at the time the order was completed, grouped by location type. Only successfully completed line items are taken into account. Rejected or canceled orders/line items are not taken into account.
Important: Since this chart is based on fulfillment orders, shipping costs and order-level promotions are not included in the revenue.
Completed revenue by store: This chart shows the total revenue of all completed (status "Fulfilled") fulfillment orders at the time the order was completed, grouped by store. Only successfully completed line items are taken into account. Rejected or canceled orders/line items are not taken into account.
Important: Since this chart is based on fulfillment orders, shipping costs and order-level promotions are not included in the revenue.
Completed revenue by fulfillment method: This chart shows the total revenue of all completed (status "Fulfilled") fulfillment orders at the time the order was completed, grouped by fulfillment method. Only successfully completed line items are taken into account. Rejected or canceled orders/line items are not taken into account.
Important: Since this chart is based on fulfillment orders, shipping costs and order-level promotions are not included in the revenue.
Ø Time until order is ready: This chart shows the average processing time of fulfillment orders, i.e. the time from creation (assignment to a store) until the order is ready for pickup / shipping.
Return rate: This chart shows the return rate per location that originally shipped the order. If there are more than 10 locations, the 5 locations with the highest and the lowest return rates as well as the average are shown. The return rate is defined as "number of returned items" / "number of shipped items". In other words, it shows what percentage of the shipped items were returned.
Example: A location shipped 100 items within the selected time period. 18 of these items were returned (it doesn't matter at which location the items were returned). The return rate of this location would be 18%.
Information: Line items that were split and shipped from different locations are not taken into account, because it can't be clearly traced which location originally shipped the item.
Exports
Several charts let you download detailed exports of the corresponding fulfillment orders:
- New fulfillment orders
- Completed fulfillment orders
- Completed revenue