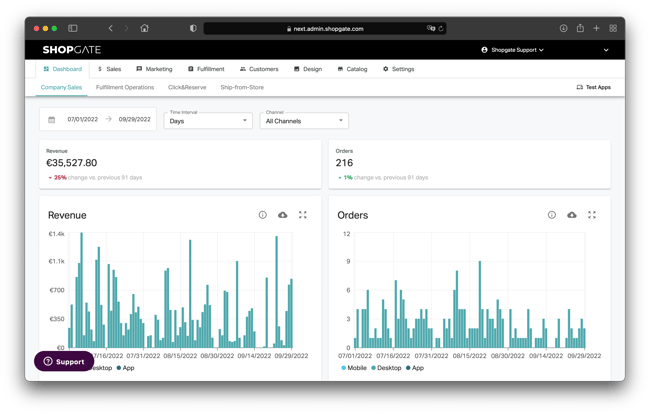
On your sales dashboard you can find all relevant figures on local sales at a glance. You have the option to specify a specific time period and filter by time interval and channel.
In the two upper cards you can see the total revenue as well as the orders over the entire set period. The trend shows the difference from the same period before.
In the individual charts you can see the data broken down according to the time interval set. Via the ℹ️ icon you can display an explanation of the diagrams, via the ⬇️ icon you can download the respective raw data as CSV.