The Ship-from-Store dashboard gives you deep insight into your fulfillment process. Here you can find all important KPIs, from the number of new orders to their distribution and fulfillment. You can freely choose the time period and time interval. In addition, you can export the raw data here as a CSV or query it via our API.
Info Boxes
The infoboxes show at a glance the most important KPIs of your Ship-from-Store process:
- Number of orders
- Average items per order
- Average number of fulfillment orders per order
- Average shipments per order
Charts
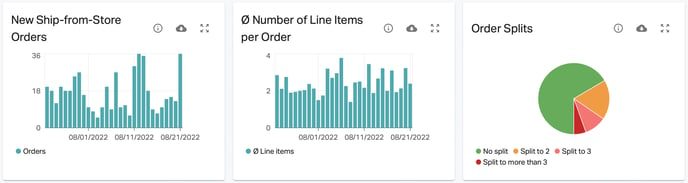
New ship-from-store orders
This chart shows the number of customer orders (regardless of their status) with at least one order item of the Direct Ship type in the selected time period, based on when they were created.
⌀ Number of Line Items per Order
Average number of items per order with Direct Ship (regardless of their status).
Order splits
This chart represents the distribution of the number of order splits per customer order. Fulfillment orders that were rejected and customer orders that could not be routed are excluded.
Order splits per day
This chart represents the distribution of the number of order splits per customer order and per selected time interval. It excludes fulfillment orders that were rejected and customer orders that could not be routed.
Shipments by order
Here you can see how many individual shipments the customer orders were split into.
Shipments per order-by-day
Here you can see how many individual shipments the customer orders were divided into, spread over a time interval.
Fulfillment order distribution
This chart shows the distribution of fulfillment orders among the different types of shipping locations (warehouses, stores, etc.).
Store Distribution
This diagram shows the distribution of fulfillment orders among shipping locations of type Store .
Warehouse Distribution
This diagram shows the distribution of fulfillment orders among the warehouse type shipping locations. Displayed only when there are at least two warehouse type locations.
Dropshipping Distribution
This chart shows the distribution of fulfillment orders among the Dropshipping type shipping locations. Displayed only if there are at least two Dropshipping type locations.
Breakdown of cancellation reasons
This chart shows the reasons for which fulfillment orders were rejected or canceled.
Product unavailable Reason
This chart represents the distribution of reasons why an item was unavailable.
Ø Time until FOs are ready
Average time from the moment the fulfillment order is created (assigned to a store) until the fulfillment order is ready for shipment. Excludes business hours and holidays.
Ø Time until SOs are fulfilled
Average duration from the time the order is placed until the customer order is fully fulfilled. This means that all associated fulfillment orders have either shipped or been canceled (at least one fulfillment order must have shipped). Excluding business hours and holidays.